It’s just been slightly over a week since our last release, and already we’ve launched the next one! In Holistics release (v1.30), we gave you Metric Sheets, which we believe to be a strong differentiating feature for our customers that showcases our strengths in handling tabular data. A big note of thanks to our fans and customers who’ve been telling us how much they value our product, this recent change was a huge one in terms of code for the product engineering team, and it’s feedback like yours that keeps us going!
Eliyahu Goldratt said “Tell me how you measure me and I will tell you how I will behave”, and nowhere does this seem more pertinent than in the case of building a culture of metrics (ala Jeff Bezos of Amazon) for the growth of your business. At Holistics, we believe in the power of simplicity, especially when it comes to presenting the most important information at a glance.
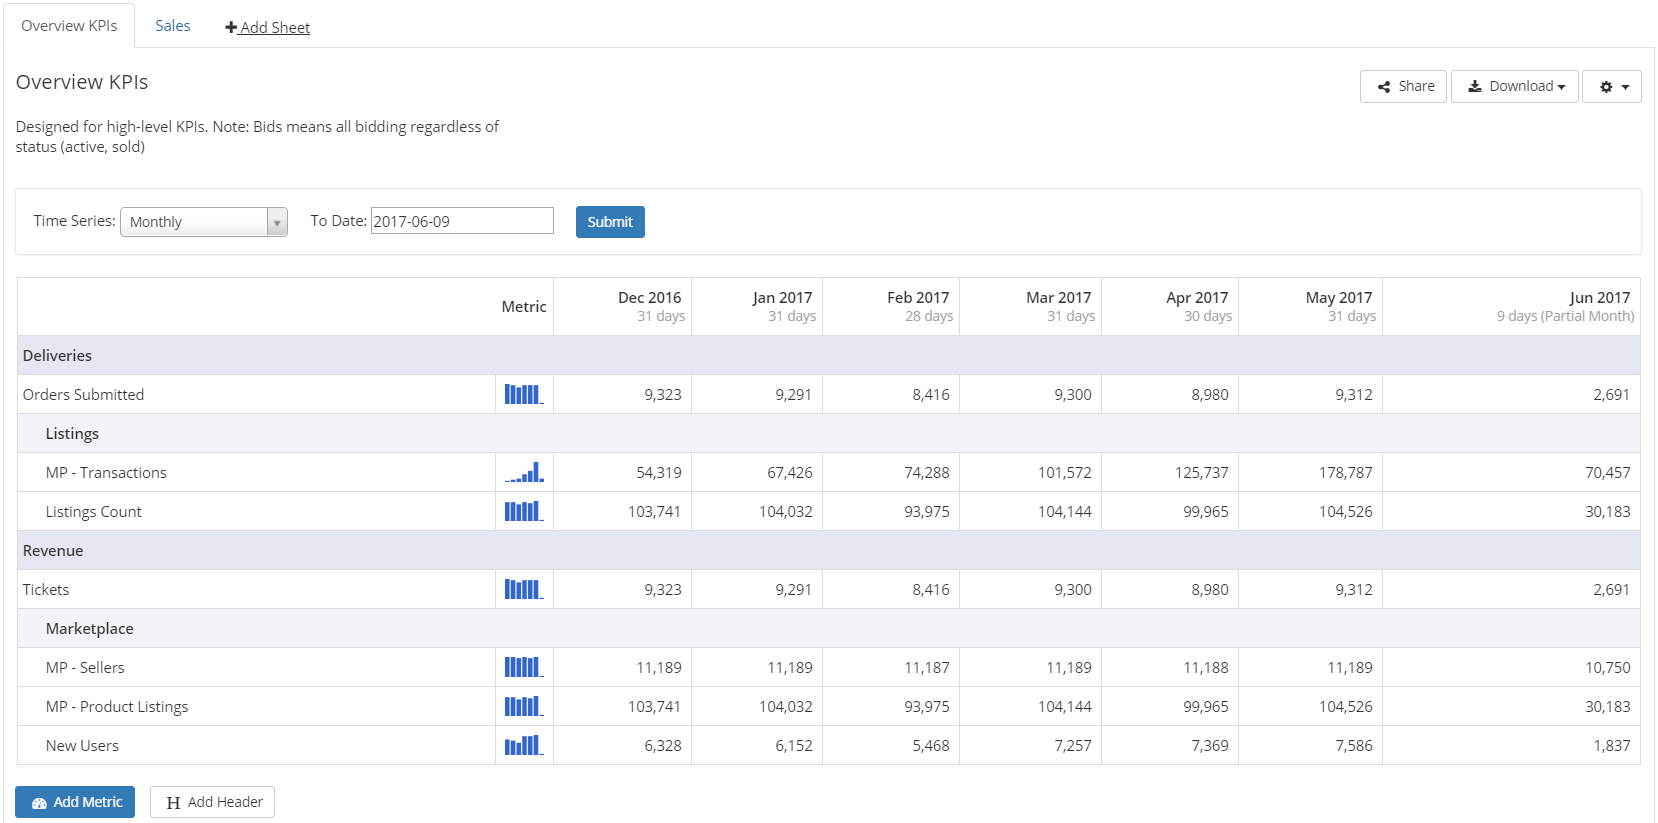
With Metric Sheets, we do exactly that, allowing you to have a bird’s eye view of the most important indicators and time-series data in your business! Some of our customers have as many as a hundred rows of metrics that they track, which makes it unfeasible to present as a dashboard. What is needed is a single condensed spreadsheet of information, and this is what Metric Sheets was built for.
Define your most important metrics just once, Holistics will do the rest
Metrics and key performance indicators (KPIs) are an integral part of tracking how well your business is doing. These are invaluable to a wide range of players, from your business teams to investors, venture capitalists and more. And when it comes to securing quality funding, this would be near impossible without demonstrating a strong setup and focus on the important measures that matter.
When it comes to working with data reporting, we believe that there is a time and place for visualizations, however the most important thing is to maintain a laser sharp focus on the underlying goals; on the content, rather than the form. There is a time for graphics, and there’s a time for presenting information as tables. Just imagine trying to convey this table of metrics as a dashboard of visualizations!

So how can we capture this wide range of information in a single place? As we like to do, we decided to make this process as simple as possible for you, requiring just a one time setup to define your metrics to add to your sheet. Metric Sheets allows you to naturally stack each of your existing Holistics metric reports on top of each other, so that they can be viewed as a tabular list. Holistics metrics are automatically queried straight from your database, so the most up to date measures will be calculated and compiled with the latest data you have, whenever you open your Holistics platform! No more repeated KPI report preparation needed, so you can focus on what matters most - building your business.

Metrics often fall into some of these following groups:
- Product
- Customer
- Sales and marketing
- Operations
- Financial
For example, say that we have decided that “Orders Submitted” is an important metric to include (and the importance of picking the right metrics for your business is a story for another time!).
 Defining a metric in Holistics requires just a simple SQL query, with the {{time_where}} string included within.
The “Orders Submitted” metric above was generated from this following query here, which now allows us to configure
the time period view based upon the filter on the Metric Sheets page.
SELECT count(1) FROM bookings
WHERE {{time_where}}
Once finished, you can then add the metric to your chosen metric sheet, creating your own categories like “Management”, “Operations”, “Sales and Marketing” and so on. Combined with the other Holistics features such as permission access controls, shareable links, filters and more, you’ve just created a powerful repository of information where all the key measures of your business resides! For more information on how to build metrics in Holistics, follow the link here to our documentation page on metrics.
Like how Amazon had their weekly meetings where “numbers alone must demonstrate what’s working and what’s broken, how customers are behaving, and ultimately how well the company overall is performing”, at Holistics, we believe that the most important thing is to empower your ability to act upon information. As startups or tech companies, we have little to no excuse to not leverage upon the rich data at our disposal to drive decision making, and we at Holistics are here to help you make that process as seamless as possible. Sometimes the most effective explanations (or reports) are the simplest!

