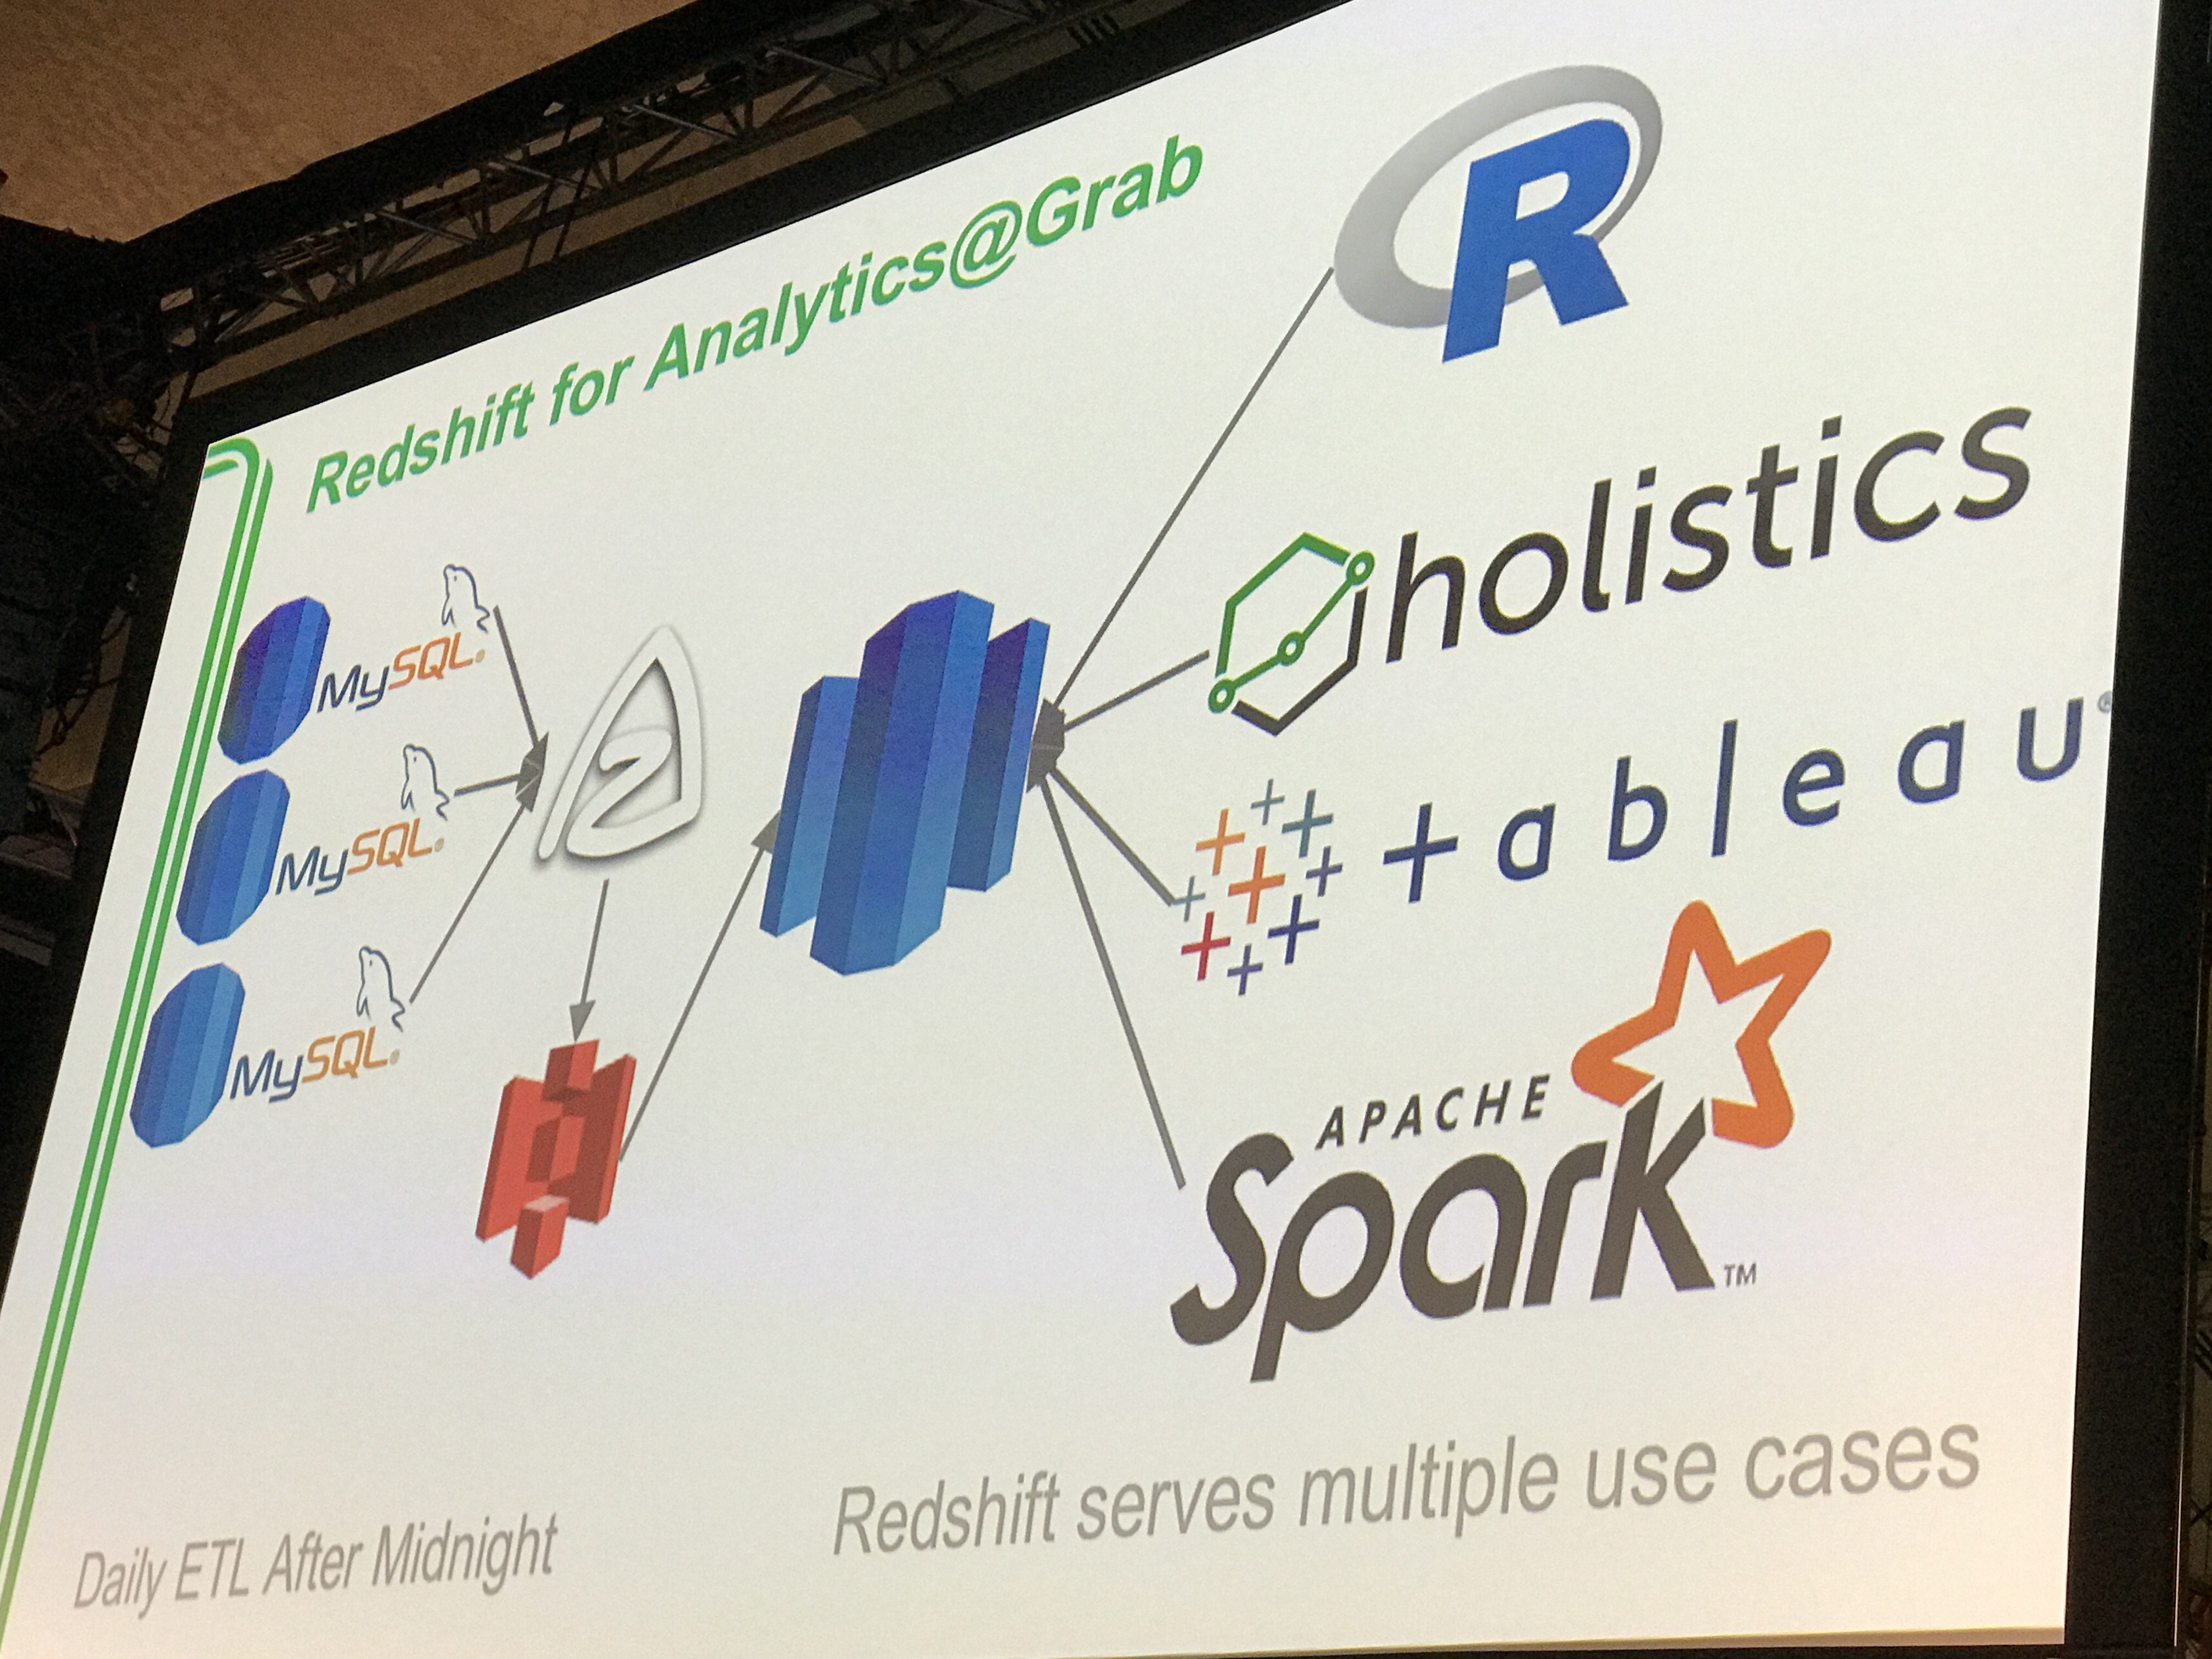
 Holistics featured at Grab Engineering’s presentation at AWS Summit Singapore 2017, alongside with Tableau
Holistics gives you more flexibility and control over Tableau for data extraction and preparation.
1. Ask Better Questions
Tableau is good for reporting organized data (where you already have the data in your columns), but it falls short for business and operational reporting where you need more specific reports across different tables.
While not impossible, it is challenging to write reports such as the following with their GUI interface unless you have prepared your data before.
- How many users made their first purchase in the past week?
- How many users bought at least 3 items from us in the past month?
- How many users bought a book from at least 2 out of 3 genres in the past year?
The other alternative Tableau provides is for you to build your own materialized views (which they don’t help in). The effort to prepare those data might have discouraged you from asking some questions!
Holistics gives you the flexibility of SQL (an open standard) to extract the exact data you need for your reports. Designed for SQL analysts, our user-interface does not discourage you from using SQL.
2. Tabular Data
Tableau is good in visualization. However, if your primary use case is for your users to export the data CSV/Excel files, such as a tabular report with many rows of detailed data - Tableau will not be the suitable tool for you.
Holistics presents both visualization and tabular data in an effective way for you to present your information. They are also presented to be navigated easily (like how you organize files in Google Drive).
You can filter your report by user demographics, behaviors or purchase patterns through adding report fields such as the following:
- Date and Date Range fields
- Drop-down fields to filter by dimension
- List fields to allow multiple inputs
- Text fields to capture any generic entry
If you need tabular records to do root-cause analysis or to identify specific criteria, Holistics is the perfect tool for you.
3. Holistics is designed for SQL Analysts
From the business user perspective, Tableau and Holistics lets them filter the data they need in their reports easily.
From the report creation perspective, Tableau is designed for non-technical analysts who’s not familiar with SQL (and avoids it). Their user interface is designed to work through drag and drop, and they discourage the use of SQL (even though they allow custom SQL).
Holistics does not get in the way of SQL analysts (good data analysts know SQL) to get the data they need. It is designed to address the gaps in SQL for reporting such as:
- Accept user inputs as parameters into your report SQL query
- Add charts to your SQL query results
- Pivot the results of your SQL query
- Query Templates lets you reuse commonly-used SQL syntax across multiple reports.
- Use SQL to populate drop-down filter values
tl;dr
In short, Holistics provides data analysts more flexibility than Tableau to extract the specific data-sets they need for their reports.
Our interface does not get in the way of SQL analysts. Your business users can filter the data in their reports with no training required.
Ready to try Holistics?
Our software works without the need to store your data, and there’s virtually zero integration efforts! 93% of our customers created their first report within 10 minutes of connecting their database. (The record we have currently is a team of 3 analysts who created 450 reports in under 2 months with no help from the Holistics team!)